Technical Report
Questions
Below Zero - ice cream store The local ice-cream store needs a new ordering system to improve customer service by streamlining the ordering process. The manager of the store has found that many orders are incorrect and staff at times enter incorrect prices. The manager wants a new ordering system to avoid these errors and to ensure correct prices are charged. At present, the customer selects what to put the ice-cream in: plain cone, waffle, cone or a cup. The customer also chooses how many scoops and the flavours of each scoop. There are currently eight flavours to choose from. The management are hoping to have a system developed where staff enter the order at stations where the price is calculated, and the customer pays. The order is then sent to staff at the counters who complete the order and give it to the customer. In addition to the ordering system, Below Zero have asked for some analysis on the current trends in ice cream sales in the five neighbouring regions. As a result, you were able to source weekly sales data for 45 stores over 3 years (2010 – 2012). Learning Objectives In this task you will learn how to:
- 👉 Write programs that produce correct and useful output
- 👉 Apply relevant Python programming concepts to a data analysis challenge
- 👉 Read data from real sources and wrangle it into the form you need
- 👉 Develop creative approaches to solving the wrangling/analysis problems
- 👉 Adhere to the recommended Python programming styles
- 👉 Organise and present a data analysis report
- 👉 For each ice cream, the cone type, scoop amount, scoop flavour, number and type of toppings should be taken from the customer
- 👉 At the end the program should display the itemised order with the total price
- 👉 At the end the program should display the itemised order with the total price.
Solution
1. Introduction
The time series sales data is an important asset for any organization. For Below Zero company also the sales data can provide a lot of information about the trends of company profit. A sales analysis will provide the company a complete view of the business revenue trends. This report the various analyses through visualisation tools. In the upcoming parts some insights from the sales data is given.
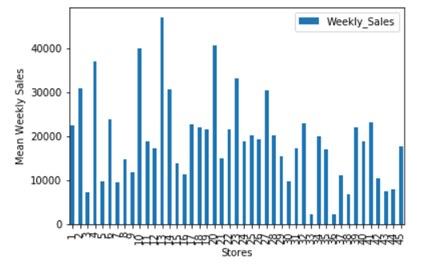
2. Store Wise Weekly Sales
The store wise weekly sales of the data over the given time series is shown in fig. 1.It can be seen the cumulative sales of store number 13 are the highest. The mean of the weekly sales data shows that Store number 13 has the highest sales as compared to the other regions. The store wise plot shows the stores with poor sales are 3, 36,38, 43 and some stores show excellent sales records like store number 13,10, 4 etc. The company can decide on which stores can be shut down due to their poor sales records. Also, the factors that can improve the sales can be analysed.
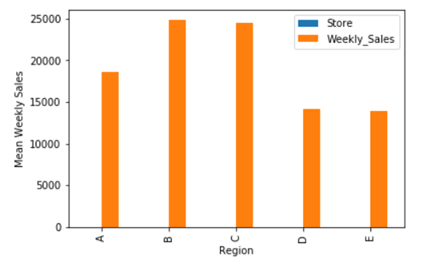
3. Region wise Mean Weekly sales
The stores are divided in Five regions A,B,C,D and E. Each region has nine stores. The mean weekly sales of each region is also analysed by combining the sales of stores of each region. The plot is shown in figure 2. It is seen that Region B and C have comparable sales. However region B has slightly higher sales than region C. Region D and E have similar weekly sales records. The\is data shows that the regions with high sales consist of stores that have significantly higher sales records. However one or two stores with poor bring down the sales records of the entire region as mean values are considered while plotting the sales data.